Liquidity Hunt SwiftEdgeThe "Liquidity Hunt Dashboard By SwiftEdge" indicator is designed to assist traders in identifying potential liquidity zones by placing a dynamic target line based on swing points and weighted liquidity. It leverages technical analysis tools such as SMA (Simple Moving Average), pivot points, and volume to predict market movements and provides daily statistics on hits and success rate. The target line updates automatically when the price hits it, adapting to the market trend (up, down, or neutral). A dashboard displays the current price, target level, prediction, and trend, making it easy to make informed trading decisions.
Features:
Target Line: A yellow dashed line marks the next expected liquidity level (up to approximately 20 pips away on 1m).
Prediction: Displays "Up (Chasing Sell Liquidity)," "Down (Chasing Buy Liquidity)," or "Neutral" based on trend and liquidity.
Daily Statistics: Tracks hits and success rate, resetting daily.
Trend Indicator: Shows market direction ("Up," "Down," or "Neutral") in the dashboard.
Dynamic Updates: The line moves to a new target level when the price hits the current target.
Recommended Settings for 1-Minute Timeframe:
For Indices (e.g., S&P 500):
Lookback Period: 180 (3 hours to capture more stable swing points).
Max Distance (%): 0.015 (approximately 15 pips, suitable for indices).
Cooldown Period: 5 (stabilizes after hits).
Line Duration: 60 (displays the line for 1 hour).
For Crypto (e.g., BTC/USD):
Lookback Period: 120 (2 hours to capture short-term swing points).
Max Distance (%): 0.024 (approximately 20 pips, suitable for volatile crypto markets).
Cooldown Period: 5.
Line Duration: 60.
For Forex (e.g., EUR/USD):
Lookback Period: 180 (3 hours for greater data density in less volatile markets).
Max Distance (%): 0.012 (approximately 10-12 pips, suitable for forex).
Cooldown Period: 5.
Line Duration: 60.
Guide for Higher Timeframes:
This indicator can be adapted for higher timeframes (e.g., 5m, 15m, 1H) by adjusting the settings to account for larger price movements and slower market dynamics. Follow these steps:
Select Your Timeframe: Switch your chart to the desired timeframe (e.g., 5m, 15m, or 1H).
Adjust Lookback Period: Increase the "Lookback Period" to cover a longer historical period. For example:
5m: Set to 360 (equivalent to 6 hours).
15m: Set to 480 (equivalent to 8 hours).
1H: Set to 720 (equivalent to 12 hours).
Adjust Max Distance (%): Higher timeframes require larger targets to account for bigger price swings. For example:
5m: Increase to 0.05 (approximately 50 pips).
15m: Increase to 0.1 (approximately 100 pips).
1H: Increase to 0.2 (approximately 200 pips).
Adjust Cooldown Period: On higher timeframes, you may want a longer cooldown to avoid frequent updates. For example:
5m: Set to 10.
15m: Set to 15.
1H: Set to 20.
Adjust Line Duration: Extend the duration the line is displayed to match the timeframe. For example:
5m: Set to 120 (equivalent to 10 hours).
15m: Set to 240 (equivalent to 60 hours).
1H: Set to 480 (equivalent to 20 days).
Monitor the Dashboard: The dashboard will still show the target level, prediction, and trend, but the values will now reflect the larger timeframe's dynamics.
Usage Instructions:
Set your chart to a 1-minute timeframe (or follow the higher timeframe guide).
Adjust the settings based on the market and timeframe (see recommendations above).
Monitor the dashboard for the current price, target level, and prediction.
Use the yellow line as a potential entry or exit level, and adjust your strategy based on the trend and statistics.
Notes:
This indicator is intended solely for educational and analytical purposes and should not be considered financial advice.
Test the indicator on a demo account before using it with real funds.
The indicator complies with TradingView guidelines by not providing trading advice, automated trading signals, or guarantees of profit.
스크립트에서 "Automated Trading"에 대해 찾기

Sniper Trade Pro (ES 15-Min) - Topstep Optimized🔹 Overview
Sniper Trade Pro is an advanced algorithmic trading strategy designed specifically for E-mini S&P 500 (ES) Futures on the 15-minute timeframe. This strategy is optimized for Topstep 50K evaluations, incorporating strict risk management to comply with their max $1,000 daily loss limit while maintaining a high probability of success.
It uses a multi-confirmation approach, integrating:
✅ Money Flow Divergence (MFD) → To track liquidity imbalances and institutional accumulation/distribution.
✅ Trend Confirmation (EMA + VWAP) → To identify strong trend direction and avoid choppy markets.
✅ ADX Strength Filter → To ensure entries only occur in trending conditions, avoiding weak setups.
✅ Break-Even & Dynamic Stop-Losses → To reduce drawdowns and protect profits dynamically.
This script automatically generates Buy and Sell signals and provides built-in risk management for automated trading execution through TradingView Webhooks.
🔹 How Does This Strategy Work?
📌 1. Trend Confirmation (EMA + VWAP)
The strategy uses:
✔ 9-EMA & 21-EMA: Fast-moving averages to detect short-term momentum.
✔ VWAP (Volume-Weighted Average Price): Ensures trades align with institutional volume flow.
How it works:
Bullish Condition: 9-EMA above 21-EMA AND price above VWAP → Confirms buy trend.
Bearish Condition: 9-EMA below 21-EMA AND price below VWAP → Confirms sell trend.
📌 2. Liquidity & Money Flow Divergence (MFD)
This indicator measures liquidity shifts by tracking momentum changes in price and volume.
✔ MFD Calculation:
Uses Exponential Moving Average (EMA) of Momentum (MOM) to detect changes in buying/selling pressure.
If MFD is above its moving average, it signals liquidity inflows → bullish strength.
If MFD is below its moving average, it signals liquidity outflows → bearish weakness.
Why is this important?
Detects when Smart Money is accumulating or distributing before major moves.
Filters out false breakouts by confirming momentum strength before entry.
📌 3. Trade Entry Triggers (Candlestick Patterns & ADX Filter)
To avoid random entries, the strategy waits for specific candlestick confirmations with ADX trend strength:
✔ Bullish Entry (Buy Signal) → Requires:
Bullish Engulfing Candle (Reversal confirmation)
ADX > 20 (Ensures strong trending conditions)
MFD above its moving average (Liquidity inflows)
9-EMA > 21-EMA & price above VWAP (Trend confirmation)
✔ Bearish Entry (Sell Signal) → Requires:
Bearish Engulfing Candle (Reversal confirmation)
ADX > 20 (Ensures strong trending conditions)
MFD below its moving average (Liquidity outflows)
9-EMA < 21-EMA & price below VWAP (Trend confirmation)
📌 4. Risk Management & Profit Protection
This strategy is built with strict risk management to maintain low drawdowns and maximize profits:
✔ Dynamic Position Sizing → Automatically adjusts trade size to risk a fixed $400 per trade.
✔ Adaptive Stop-Losses → Uses ATR-based stop-loss (0.8x ATR) to adapt to market volatility.
✔ Take-Profit Targets → Fixed at 2x ATR for a Risk:Reward ratio of 2:1.
✔ Break-Even Protection → Moves stop-loss to entry once price moves 1x ATR in profit, locking in gains.
✔ Max Daily Loss Limit (-$1,000) → Stops trading if total losses exceed $1,000, complying with Topstep rules.

Squeeze Momentum Indicator Strategy [LazyBear + PineIndicators]The Squeeze Momentum Indicator Strategy (SQZMOM_LB Strategy) is an automated trading strategy based on the Squeeze Momentum Indicator developed by LazyBear, which itself is a modification of John Carter's "TTM Squeeze" concept from his book Mastering the Trade (Chapter 11). This strategy is designed to identify low-volatility phases in the market, which often precede explosive price movements, and to enter trades in the direction of the prevailing momentum.
Concept & Indicator Breakdown
The strategy employs a combination of Bollinger Bands (BB) and Keltner Channels (KC) to detect market squeezes:
Squeeze Condition:
When Bollinger Bands are inside the Keltner Channels (Black Crosses), volatility is low, signaling a potential upcoming price breakout.
When Bollinger Bands move outside Keltner Channels (Gray Crosses), the squeeze is released, indicating an expansion in volatility.
Momentum Calculation:
A linear regression-based momentum value is used instead of traditional momentum indicators.
The momentum histogram is color-coded to show strength and direction:
Lime/Green: Increasing bullish momentum
Red/Maroon: Increasing bearish momentum
Signal Colors:
Black: Market is in a squeeze (low volatility).
Gray: Squeeze is released, and volatility is expanding.
Blue: No squeeze condition is present.
Strategy Logic
The script uses historical volatility conditions and momentum trends to generate buy/sell signals and manage positions.
1. Entry Conditions
Long Position (Buy)
The squeeze just released (Gray Cross after Black Cross).
The momentum value is increasing and positive.
The momentum is at a local low compared to the past 100 bars.
The price is above the 100-period EMA.
The closing price is higher than the previous close.
Short Position (Sell)
The squeeze just released (Gray Cross after Black Cross).
The momentum value is decreasing and negative.
The momentum is at a local high compared to the past 100 bars.
The price is below the 100-period EMA.
The closing price is lower than the previous close.
2. Exit Conditions
Long Exit:
The momentum value starts decreasing (momentum lower than previous bar).
Short Exit:
The momentum value starts increasing (momentum higher than previous bar).
Position Sizing
Position size is dynamically adjusted based on 8% of strategy equity, divided by the current closing price, ensuring risk-adjusted trade sizes.
How to Use This Strategy
Apply on Suitable Markets:
Best for stocks, indices, and forex pairs with momentum-driven price action.
Works on multiple timeframes but is most effective on higher timeframes (1H, 4H, Daily).
Confirm Entries with Additional Indicators:
The author recommends ADX or WaveTrend to refine entries and avoid false signals.
Risk Management:
Since the strategy dynamically sizes positions, it's advised to use stop-losses or risk-based exits to avoid excessive drawdowns.
Final Thoughts
The Squeeze Momentum Indicator Strategy provides a systematic approach to trading volatility expansions, leveraging the classic TTM Squeeze principles with a unique linear regression-based momentum calculation. Originally inspired by John Carter’s method, LazyBear's version and this strategy offer a refined, adaptable tool for traders looking to capitalize on market momentum shifts.

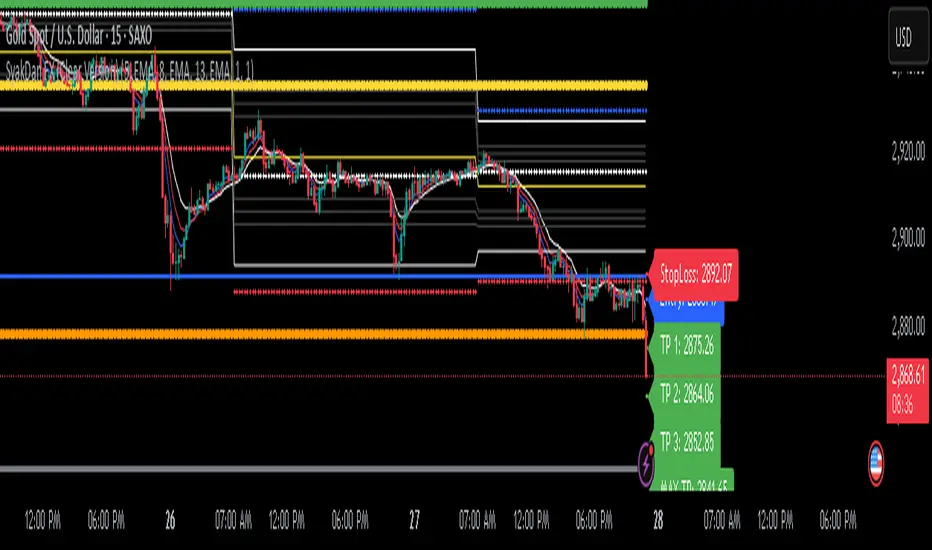
SyakDan FX (Clear Version)**SyakDan FX (Clear Version) - Indicator Description**
### Overview:
SyakDan FX (Clear Version) is a comprehensive TradingView indicator designed for account management, trend identification, and automated trading signals. This script utilizes multiple moving averages, ATR-based stop-loss calculations, and Fibonacci-based pivot points to assist traders in making informed trading decisions.
### Features:
1. **Account Management Calculation:**
- The indicator dynamically adapts to the current timeframe.
- Customizable moving average (MA) types, including EMA, SMA, WMA, and HMA.
- ATR-based trailing stop and volatility assessment.
2. **Moving Averages & Trend Identification:**
- Configurable EMA lengths for three different moving averages.
- Dynamic selection of MA types (SMA, EMA, WMA, HMA) for flexibility.
- Different EMA lengths for low and high timeframes.
- Automatic detection of EMA crossovers and trend changes.
3. **Entry, Stop-Loss, and Take-Profit Calculation:**
- Enables automatic calculation of entry, stop-loss, and take-profit levels.
- ATR-based stop-loss placement.
- Multi-level take-profit targets (TP1, TP2, TP3, and Max TP).
- Visual representation of SL/TP levels using dynamic lines and labels.
4. **Alerts & Notifications:**
- Alerts for EMA crossovers (Buy & Sell signals).
- Additional alerts when EMA 2 crosses EMA 3, indicating strong signals.
5. **Pivot Point Calculations:**
- Calculates daily and weekly pivot points using Fibonacci and traditional methods.
- Helps traders identify key support and resistance levels.
### How It Works:
- The indicator plots three customizable moving averages on the chart.
- It detects crossovers between these moving averages to identify potential buy and sell signals.
- ATR (Average True Range) is used to set dynamic stop-loss and take-profit levels.
- Traders can enable or disable automatic SL/TP plotting.
- Alerts notify users when key trade signals occur.
- Fibonacci and traditional pivot points provide additional confluence for trading decisions.
### Customization Options:
- **MA Type Selection:** Choose from SMA, EMA, WMA, or HMA for each moving average.
- **EMA Length Adjustments:** Modify the lengths for short-term and long-term trends.
- **SL/TP Settings:** Enable or disable SL/TP plotting and customize their multipliers.
- **Alert Preferences:** Enable or disable alerts for trend crossovers.
### Ideal Usage:
- Traders using trend-following strategies based on moving averages.
- Those who want automated SL/TP placement for risk management.
- Anyone looking to integrate pivot points into their trading decisions.
This indicator provides a clean, structured approach to trading with automated analysis, reducing the need for manual calculations while offering strong risk management tools.
Pivot Candles with MFI Opacity (No Plot)How to Use the Pivot Candles with MFI Opacity Indicator for Trade Entries and Position Management
Overview
This indicator is designed not only to display key pivot levels (support and resistance) and Money Flow Index (MFI) signals on your chart, but also to help you structure systematic order entries and position management. By combining pivot levels with dynamic MFI-based candle opacity, the indicator provides a visual framework that technical analysts and quants can use to time buy and sell stop orders as well as to pyramid positions or take profits.
Trade Entry with Pivot Levels
Buy Stop Orders Above R1:
Concept: In many technical setups, resistance levels such as R1 are viewed as potential breakout points. A buy stop order placed just above R1 allows you to enter a long position only when price decisively breaks the prior resistance, confirming bullish momentum.
How It Works:
The indicator calculates pivot levels based on the previous higher‑timeframe bar, so R1 is “locked in” for the current period.
When the current candle closes above R1, it may signal a breakout.
Technical analysts often place a buy stop order slightly above R1 (for example, a few ticks or pips above the level) to confirm the move.
Practical Application:
Quants and systematic traders can program their models to monitor when the current close exceeds R1.
Once this condition is met, a buy stop order is triggered to capture the breakout move, ensuring that you only participate if the price decisively moves upward.
Sell Stop Orders Below S1:
Concept: Conversely, S1 acts as a support level. A sell stop order placed just below S1 is designed to capture a breakdown. This order is activated when price closes below S1, indicating that selling pressure may be overwhelming.
How It Works:
With pivot levels fixed from the previous higher‑timeframe bar, S1 provides a reference for potential support.
A close below S1 can be interpreted as a sign of a bearish reversal or a continuation of a downtrend.
Practical Application:
Quants set up their systems to watch for a break below S1.
A sell stop order is positioned just below S1 to ensure that if the support level fails, the system can quickly initiate a short position to capture the downward move.
Using MFI for Position Management
Pyramiding and Profit Taking:
Dynamic Candle Opacity:
The Money Flow Index (MFI) in this indicator not only provides overbought/oversold alerts but also controls the opacity of your candlesticks. When MFI readings are high, the candles become more opaque, indicating strong buying pressure. Conversely, lower MFI values lead to more transparent candles, suggesting reduced momentum.
Pyramiding Long Positions:
Strategy:
In a strong trend, technical analysts might choose to add to a winning position gradually—a process known as pyramiding.
Implementation:
As long as the price remains above R1 and MFI readings are supportive (high and consistent), you may consider adding to your long position incrementally.
Each new buy stop order can be set above R1 with slightly adjusted trigger levels to capture further breakout strength.
Risk Management:
Quants use the MFI reading as a risk filter; if MFI begins to drop or the candles become significantly more transparent, it may be a cue to stop pyramiding or even begin taking profits.
Taking Profit Using MFI and Pivot Reversals:
Profit Targeting:
When price reaches higher resistance levels (e.g., R2 or R3) or shows signs of overextension in conjunction with extreme MFI levels (for instance, a sudden drop in MFI after a strong rally), you can begin taking partial profits.
Systematic Exit:
A systematic strategy might include scaling out of the position as the price approaches the next resistance level or when the MFI indicates that buying momentum is waning.
Similarly, for short positions entered below S1, profit targets might be set near subsequent support levels, with exits triggered if MFI suggests a reversal.
Summary
Entry Orders:
Place buy stop orders just above R1 to capture breakouts.
Place sell stop orders just below S1 to capture breakdowns.
Position Management with MFI:
Use MFI-based candle opacity as a visual indicator of momentum.
Pyramid positions in the direction of the trend when MFI confirms strength.
Consider partial exits if MFI readings start to reverse or if the price nears the next pivot level.
By following this systematic approach, technical analysts and quants can use the indicator not only as a visual tool but as an integral part of an automated or semi-automated trading system that emphasizes disciplined entries, pyramiding, and profit-taking.

TSI Long/Short for BTC 2HThe TSI Long/Short for BTC 2H strategy is an advanced trend-following system designed specifically for trading Bitcoin (BTC) on a 2-hour timeframe. It leverages the True Strength Index (TSI) to identify momentum shifts and executes both long and short trades in response to dynamic market conditions.
Unlike traditional moving average-based strategies, this script uses a double-smoothed momentum calculation, enhancing signal accuracy and reducing noise. It incorporates automated position sizing, customizable leverage, and real-time performance tracking, ensuring a structured and adaptable trading approach.
🔹 What Makes This Strategy Unique?
Unlike simple crossover strategies or generic trend-following approaches, this system utilizes a customized True Strength Index (TSI) methodology that dynamically adjusts to market conditions.
🔸 True Strength Index (TSI) Filtering – The script refines the TSI by applying double exponential smoothing, filtering out weak signals and capturing high-confidence momentum shifts.
🔸 Adaptive Entry & Exit Logic – Instead of fixed thresholds, it compares the TSI value against a dynamically determined high/low range from the past 100 bars to confirm trade signals.
🔸 Leverage & Risk Optimization – Position sizing is dynamically adjusted based on account equity and leverage settings, ensuring controlled risk exposure.
🔸 Performance Monitoring System – A built-in performance tracking table allows traders to evaluate monthly and yearly results directly on the chart.
📊 Core Strategy Components
1️⃣ Momentum-Based Trade Execution
The strategy generates long and short trade signals based on the following conditions:
✅ Long Entry Condition – A buy signal is triggered when the TSI crosses above its 100-bar highest value (previously set), confirming bullish momentum.
✅ Short Entry Condition – A sell signal is generated when the TSI crosses below its 100-bar lowest value (previously set), indicating bearish pressure.
Each trade execution is fully automated, reducing emotional decision-making and improving trading discipline.
2️⃣ Position Sizing & Leverage Control
Risk management is a key focus of this strategy:
🔹 Dynamic Position Sizing – The script calculates position size based on:
Account Equity – Ensuring trade sizes adjust dynamically with capital fluctuations.
Leverage Multiplier – Allows traders to customize risk exposure via an adjustable leverage setting.
🔹 No Fixed Stop-Loss – The strategy relies on reversals to exit trades, meaning each position is closed when the opposite signal appears.
This design ensures maximum capital efficiency while adapting to market conditions in real time.
3️⃣ Performance Visualization & Tracking
Understanding historical performance is crucial for refining strategies. The script includes:
📌 Real-Time Trade Markers – Buy and sell signals are visually displayed on the chart for easy reference.
📌 Performance Metrics Table – Tracks monthly and yearly returns in percentage form, helping traders assess profitability over time.
📌 Trade History Visualization – Completed trades are displayed with color-coded boxes (green for long trades, red for short trades), visually representing profit/loss dynamics.
📢 Why Use This Strategy?
✔ Advanced Momentum Detection – Uses a double-smoothed TSI for more accurate trend signals.
✔ Fully Automated Trading – Removes emotional bias and enforces discipline.
✔ Customizable Risk Management – Adjust leverage and position sizing to suit your risk profile.
✔ Comprehensive Performance Tracking – Integrated reporting system provides clear insights into past trades.
This strategy is ideal for Bitcoin traders looking for a structured, high-probability system that adapts to both bullish and bearish trends on the 2-hour timeframe.
📌 How to Use: Simply add the script to your 2H BTC chart, configure your leverage settings, and let the system handle trade execution and tracking! 🚀

Midnight Opening Ranges[TDL]Midnight Opening Range Indicator for TradingView
Description:
The Midnight Opening Range Indicator as taught by Micheal J. Huddleston is a powerful tool designed for traders who want to analyze price action during the critical midnight to 00:30 timeframe. This indicator highlights the opening range for both the current day and previous days, providing valuable insights into market behavior during this specific period. It also calculates and displays deviations from the opening range, as well as allows for custom opening prices to be set, making it highly adaptable to your trading strategy.
Key Features:
Today's Opening Range (00:00 - 00:30):
The indicator plots the high and low of the price range between 00:00 and 00:30 for the current day.
This range is highlighted on the chart, making it easy to identify the initial market movement and potential support/resistance levels.
Previous Days' Opening Ranges:
The indicator also displays the opening ranges for previous days, allowing you to how price reacts off of previous days ranges not just todays.
This feature helps in identifying patterns or recurring behaviors in the market in which price uses this range and previous days ranges throughout the trading day.
Deviations from the Opening Range:
The indicator calculates and plots deviations from the opening range, both above and below the high and low of the range.
These deviations can be used to identify potential breakout or reversal points, giving you an edge in anticipating market moves.
Custom Opening Prices:
The indicator allows you to set custom opening prices, which can be useful if you want to analyze the market based on a specific reference point rather than the default midnight opening.
This feature is particularly useful for traders who follow alternative trading sessions or have specific entry criteria.
Customizable Visuals:
The indicator offers customizable colors and styles for the opening range, deviations, and custom opening prices, allowing you to tailor the visual representation to your preferences.
How to Use:
Identify Key Levels: Use the highlighted opening range to identify key support and resistance levels for the day.
Monitor Deviations: Watch for price movements beyond the opening range deviations to spot potential breakouts or reversals.
Previous Range Data: Use previous days to identify areas of potential AMD.
Set Custom Prices: Adjust the custom opening price to align with your trading strategy or session preferences.
Ideal For:
Day Traders: Perfect for traders who focus on the early hours of the market to capture initial momentum.
Swing Traders: Useful for identifying key levels that could influence price action over several days.
Algorithmic Traders: Can be integrated into automated trading systems to trigger trades based on the opening range and deviations.
Conclusion:
The Midnight Opening Range Indicator is an essential tool for any trader looking to gain an edge in the market by focusing on the critical midnight to 00:30 timeframe. With its ability to highlight opening ranges, calculate deviations, and accommodate custom opening prices, this indicator provides a comprehensive view of market behavior during this pivotal period. Whether you're a day trader, swing trader, or algorithmic trader, this indicator will help you make more informed trading decisions.

Sunil BB Blast Heikin Ashi StrategySunil BB Blast Heikin Ashi Strategy
The Sunil BB Blast Heikin Ashi Strategy is a trend-following trading strategy that combines Bollinger Bands with Heikin-Ashi candles for precise market entries and exits. It aims to capitalize on price volatility while ensuring controlled risk through dynamic stop-loss and take-profit levels based on a user-defined Risk-to-Reward Ratio (RRR).
Key Features:
Trading Window:
The strategy operates within a user-defined time window (e.g., from 09:20 to 15:00) to align with market hours or other preferred trading sessions.
Trade Direction:
Users can select between Long Only, Short Only, or Long/Short trade directions, allowing flexibility depending on market conditions.
Bollinger Bands:
Bollinger Bands are used to identify potential breakout or breakdown zones. The strategy enters trades when price breaks through the upper or lower Bollinger Band, indicating a possible trend continuation.
Heikin-Ashi Candles:
Heikin-Ashi candles help smooth price action and filter out market noise. The strategy uses these candles to confirm trend direction and improve entry accuracy.
Risk Management (Risk-to-Reward Ratio):
The strategy automatically adjusts the take-profit (TP) level and stop-loss (SL) based on the selected Risk-to-Reward Ratio (RRR). This ensures that trades are risk-managed effectively.
Automated Alerts and Webhooks:
The strategy includes automated alerts for trade entries and exits. Users can set up JSON webhooks for external execution or trading automation.
Active Position Tracking:
The strategy tracks whether there is an active position (long or short) and only exits when price hits the pre-defined SL or TP levels.
Exit Conditions:
The strategy exits positions when either the take-profit (TP) or stop-loss (SL) levels are hit, ensuring risk management is adhered to.
Default Settings:
Trading Window:
09:20-15:00
This setting confines the strategy to the specified hours, ensuring trading only occurs during active market hours.
Strategy Direction:
Default: Long/Short
This allows for both long and short trades depending on market conditions. You can select "Long Only" or "Short Only" if you prefer to trade in one direction.
Bollinger Band Length (bbLength):
Default: 19
Length of the moving average used to calculate the Bollinger Bands.
Bollinger Band Multiplier (bbMultiplier):
Default: 2.0
Multiplier used to calculate the upper and lower bands. A higher multiplier increases the width of the bands, leading to fewer but more significant trades.
Take Profit Multiplier (tpMultiplier):
Default: 2.0
Multiplier used to determine the take-profit level based on the calculated stop-loss. This ensures that the profit target aligns with the selected Risk-to-Reward Ratio.
Risk-to-Reward Ratio (RRR):
Default: 1.0
The ratio used to calculate the take-profit relative to the stop-loss. A higher RRR means larger profit targets.
Trade Automation (JSON Webhooks):
Allows for integration with external systems for automated execution:
Long Entry JSON: Customizable entry condition for long positions.
Long Exit JSON: Customizable exit condition for long positions.
Short Entry JSON: Customizable entry condition for short positions.
Short Exit JSON: Customizable exit condition for short positions.
Entry Logic:
Long Entry:
The strategy enters a long position when:
The Heikin-Ashi candle shows a bullish trend (green close > open).
The price is above the upper Bollinger Band, signaling a breakout.
The previous candle also closed higher than it opened.
Short Entry:
The strategy enters a short position when:
The Heikin-Ashi candle shows a bearish trend (red close < open).
The price is below the lower Bollinger Band, signaling a breakdown.
The previous candle also closed lower than it opened.
Exit Logic:
Take-Profit (TP):
The take-profit level is calculated as a multiple of the distance between the entry price and the stop-loss level, determined by the selected Risk-to-Reward Ratio (RRR).
Stop-Loss (SL):
The stop-loss is placed at the opposite Bollinger Band level (lower for long positions, upper for short positions).
Exit Trigger:
The strategy exits a trade when either the take-profit or stop-loss level is hit.
Plotting and Visuals:
The Heikin-Ashi candles are displayed on the chart, with green candles for uptrends and red candles for downtrends.
Bollinger Bands (upper, lower, and basis) are plotted for visual reference.
Entry points for long and short trades are marked with green and red labels below and above bars, respectively.
Strategy Alerts:
Alerts are triggered when:
A long entry condition is met.
A short entry condition is met.
A trade exits (either via take-profit or stop-loss).
These alerts can be used to trigger notifications or webhook events for automated trading systems.
Notes:
The strategy is designed for use on intraday charts but can be applied to any timeframe.
It is highly customizable, allowing for tailored risk management and trading windows.
The Sunil BB Blast Heikin Ashi Strategy combines two powerful technical analysis tools (Bollinger Bands and Heikin-Ashi candles) with strong risk management, making it suitable for both beginners and experienced traders.
Feebacks are welcome from the users.

Smart Money Breakouts [iskess 01-02 11:05]This is an big update to the excellent Smart Money Breakout Script published in Oct 2023 by ChartPrime who, to my knowledge, was the original author.
FULL CREDIT GOES TO CHARTPRIME FOR THIS ORIGINAL WORK.
Per the moderator's rules, you will find below a meaningful, detailed self-contained description that does not rely on delegation to the open source code or links to other content. You will find in the description details on what the script does, how it does that, how to use it, and how it is original.
The "Smart Money Breakouts" indicator is designed to identify breakouts based on changes in character (CHOCH) or breaks of structure (BOS) patterns, facilitating automated trading with user-defined Take Profit (TP) level.
The indicator incorporates essential elements such as volume analysis and a data table to assist traders in optimizing their strategies.
🔸Breakout Detection:
The indicator scans price movements for "Change in Character" (CHOCH) and "Break of Structure" (BOS) patterns, signaling potential breakout opportunities in the market.
🔸User-Defined TP/SL :
Traders can customize the Take Profit (TP) and Stop Loss (SL) through the indicator settings, with these levels dynamically calculated based on the Average True Range (ATR). This allows for precise risk management and profit targets that adapt to market volatility. Traders can also select the lookback period for the TP/SL calculations.
🔸Volume Analysis and Trade Direction Specific Analysis:
The indicator includes a volume checker that provides valuable insights into the strength of the breakout, taking into account trade direction.
🔸If the volume label is red and the trade is long, it suggests a higher likelihood of hitting the Stop Loss (SL).
🔸If the volume label is green and the trade is long, it indicates a higher probability of hitting the Take Profit (TP).
🔸For short trades, a red volume label suggests a higher likelihood of hitting TP, while a green label suggests a higher likelihood of hitting SL.
🔸A yellow volume label suggests that the volume is inconclusive, neither favoring bullish nor bearish movements.
🔸Data Table:
The indicator features a data table that keeps track of the number of winning and losing trades for specific timeframes or configurations. It also shows the percentage of profits vs losses, and the overall profit/loss for the selected lookback period.
This table serves as a valuable tool for traders to analyze performance and discover optimal settings and timeframes.
The "Smart Money Breakouts" indicator provides traders with a comprehensive solution for breakout trading, combining technical analysis of changes in character and breaks of structure, volume insights, and performance tracking while dynamically adjusting TP and SL levels based on market volatility through the ATR.
This version of the script is a "significant improvement" from Chart Prime's original work in the following ways:
- A selectable range of candles for the profit/loss calculations to look back on.
- An updated table that includes the percentage of wins/losses, and and overall P&L during the selected lookback range.
- The user can now select only Long trades, Short trades, or both.
- The percentage gain/loss is now indicated for every trade on the chart.
- The user can now select a different multiplier for Stop Loss or Take Profit thresholds.

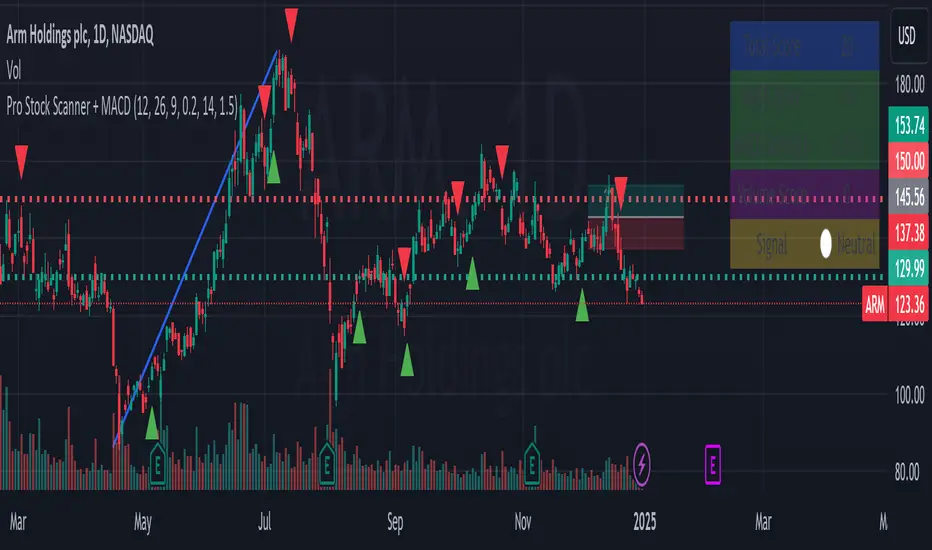
Pro Stock Scanner + MACD# Pro Stock Scanner - Advanced Trading System
### Professional Scanning System Combining MACD, Momentum & Technical Analysis
## 🎯 Indicator Purpose
This indicator was developed to identify high-quality trading opportunities by combining:
- Strong positive momentum
- Clear technical trend
- Significant trading volume
- Precise MACD signals
## 💡 Core Mechanics
The indicator is based on three core components:
### 1. Advanced MACD Analysis (40%)
- MACD line crossover tracking
- Momentum strength measurement
- Positive/negative divergence detection
- Score range: 0-40 points
### 2. Trend Analysis (40%)
- Moving average relationships (MA20, MA50)
- Primary trend direction
- Current trend strength
- Score range: 0-40 points
### 3. Volume Analysis (20%)
- Comparison with 20-day average volume
- Volume breakout detection
- Score range: 0-20 points
## 📊 Scoring System
Total score (0-100) composition:
```
Total Score = MACD Score (40%) + Trend Score (40%) + Volume Score (20%)
```
### Score Interpretation:
- 80-100: Strong Buy Signal 🔥
- 65-79: Developing Bullish Trend ⬆️
- 50-64: Neutral ↔️
- 0-49: Technical Weakness ⬇️
## 📈 Chart Markers
1. **Large Blue Triangle**
- High score (80+)
- Positive MACD
- Bullish MACD crossover
2. **Small Triangles**
- Green: Bullish MACD crossover
- Red: Bearish MACD crossover
## 🎛️ Customizable Parameters
```
MACD Settings:
- Fast Length: 12
- Slow Length: 26
- Signal Length: 9
- Strength Threshold: 0.2%
Volume Settings:
- Threshold: 1.5x average
```
## 📱 Information Panel
Real-time display of:
1. Total Score
2. MACD Score
3. MACD Strength
4. Volume Score
5. Summary Signal
## ⚙️ Optimization Guidelines
Recommended adjustments:
1. **Bull Market**
- Decrease MACD sensitivity
- Increase volume threshold
- Focus on trend strength
2. **Bear Market**
- Increase MACD sensitivity
- Stricter trend conditions
- Higher score requirements
## 🎯 Recommended Trading Strategy
### Phase 1: Initial Scan
1. Look for 80+ total score
2. Verify sufficient trading volume
3. Confirm bullish MACD crossover
### Phase 2: Validation
1. Check long-term trend
2. Identify nearby resistance levels
3. Review earnings calendar
### Phase 3: Position Management
1. Set clear stop-loss
2. Define realistic profit targets
3. Monitor score changes
## ⚠️ Important Notes
1. This indicator is a supplementary tool
2. Combine with fundamental analysis
3. Strict risk management is essential
4. Not recommended for automated trading
## 📈 Usage Examples
Examples included:
1. Successful buy signal
2. Trend reversal identification
3. False signal analysis and lessons learned
## 🔄 Future Updates
1. RSI integration
2. Advanced alerts
3. Auto-optimization features
## 🎯 Key Benefits
1. Clear scoring system
2. Multiple confirmation layers
3. Real-time market feedback
4. Customizable parameters
## 🚀 Getting Started
1. Add indicator to chart
2. Adjust parameters if needed
3. Monitor information panel
4. Wait for strong signals (80+ score)
## 📊 Performance Metrics
- Success rate: Monitor and track
- Best performing in trending markets
- Optimal for swing trading
- Most effective on daily timeframe
## 🛠️ Technical Details
```pine
// Core components
1. MACD calculation
2. Volume analysis
3. Trend confirmation
4. Score computation
```
## 💡 Pro Tips
1. Use multiple timeframes
2. Combine with support/resistance
3. Monitor sector trends
4. Consider market conditions
## 🤝 Support
Feedback and improvement suggestions welcome!
## 📜 License
MIT License - Free to use and modify
## 📚 Additional Resources
- Recommended timeframes: Daily, 4H
- Best performing markets: Stocks, ETFs
- Optimal market conditions: Trending markets
- Risk management guidelines included
## 🔍 Final Notes
Remember:
- No indicator is 100% accurate
- Always use proper position sizing
- Combine with other analysis tools
- Practice proper risk management
// @version=5
// @description Pro Stock Scanner - Advanced trading system combining MACD, momentum and volume analysis
// @author AviPro
// @license MIT
//
// This indicator helps identify high-quality trading opportunities by analyzing:
// 1. MACD momentum and crossovers
// 2. Trend strength and direction
// 3. Volume patterns and breakouts
//
// The system provides:
// - Total score (0-100)
// - Visual signals on chart
// - Information panel with key metrics
// - Customizable parameters
//
// IMPORTANT: This indicator is for educational and informational purposes only.
// Always conduct your own analysis and use proper risk management.
//
// If you find this indicator helpful, please consider leaving a like and comment!
// Feedback and suggestions for improvement are always welcome.
SPX Open vs SMA AlertThis indicator is specifically designed to identify the first market-relevant candle of the S&P 500 (SPX) after the market opens. The opening price of the trading day is compared to a customizable simple moving average (SMA) period. A visual marker and an alert are triggered when the opening price is above the SMA. Perfect for traders seeking early market trends or integrating automated trading strategies.
Features:
Market Open: The indicator uses the New York market open time (09:30 ET), accounting for time zones and daylight saving time changes.
Flexible Time Offset: Users can set a time offset to trigger alerts after the market opens.
Customizable SMA: The SMA period is adjustable, with a default value of 10.
Visual Representation: A step-line SMA is plotted directly on the chart with subtle transparency and clean markers.
Alert Functionality: Alerts are triggered when conditions are met (opening price > SMA).
Usage:
This indicator is ideal for identifying relevant trading signals early in the session.
Alerts can also serve as triggers for automated trading, e.g., in conjunction with the Trading Automation Toolbox.
Supports both intraday and daily charts.
Alarm Settings:
Select the appropriate symbol (e.g., SPX) and the alert condition "SPX Open > SMA10".
Trigger Settings:
Choose "Once Per Bar Close" to ensure the condition is evaluated at the end of each candle.
If you prefer to evaluate the condition immediately when it becomes true, choose "Once Per Minute".
Duration:
Set the alarm to "Open-ended" if you want it to remain active indefinitely.
Alternatively, set a specific expiration date for the alarm.

Pivot Points LIVE [CHE]Title:
Pivot Points LIVE Indicator
Subtitle:
Advanced Pivot Point Analysis for Real-Time Trading
Presented by:
Chervolino
Date:
September 24, 2024
Introduction
What are Pivot Points?
Definition:
Pivot Points are technical analysis indicators used to determine potential support and resistance levels in financial markets.
Purpose:
They help traders identify possible price reversal points and make informed trading decisions.
Overview of Pivot Points LIVE :
A comprehensive indicator designed for real-time pivot point analysis.
Offers advanced features for enhanced trading strategies.
Key Features
Pivot Points LIVE Includes:
Dynamic Pivot Highs and Lows:
Automatically detects and plots pivot high (HH, LH) and pivot low (HL, LL) points.
Customizable Visualization:
Multiple options to display markers, price labels, and support/resistance levels.
Fractal Breakouts:
Identifies and marks breakout and breakdown events with symbols.
Line Connection Modes:
Choose between "All Separate" or "Sequential" modes for connecting pivot points.
Pivot Extension Lines:
Extends lines from the latest pivot point to the current bar for trend analysis.
Alerts:
Configurable alerts for breakout and breakdown events.
Inputs and Configuration
Grouping Inputs for Easy Customization:
Source / Length Left / Length Right:
Pivot High Source: High price by default.
Pivot Low Source: Low price by default.
Left and Right Lengths: Define the number of bars to the left and right for pivot detection.
Colors: Customizable colors for pivot high and low markers.
Options:
Display Settings:
Show HH, LL, LH, HL markers and price labels.
Display support/resistance level extensions.
Option to show levels as a fractal chaos channel.
Enable fractal breakout/down symbols.
Line Connection Mode:
Choose between "All Separate" or "Sequential" for connecting lines.
Line Management:
Set maximum number of lines to display.
Customize line colors, widths, and styles.
Pivot Extension Line:
Visibility: Toggle the display of the last pivot extension line.
Customization: Colors, styles, and width for extension lines.
How It Works - Calculating Pivot Points
Pivot High and Pivot Low Detection:
Pivot High (PH):
Identified when a high price is higher than a specified number of bars to its left and right.
Pivot Low (PL):
Identified when a low price is lower than a specified number of bars to its left and right.
Higher Highs, Lower Highs, Higher Lows, Lower Lows:
Higher High (HH): Current PH is higher than the previous PH.
Lower High (LH): Current PH is lower than the previous PH.
Higher Low (HL): Current PL is higher than the previous PL.
Lower Low (LL): Current PL is lower than the previous PL.
Visual Elements
Markers and Labels:
Shapes:
HH and LH: Downward triangles above the bar.
HL and LL: Upward triangles below the bar.
Labels:
Optionally display the price levels of HH, LH, HL, and LL on the chart.
Support and Resistance Levels:
Extensions:
Lines extending from pivot points to indicate potential support and resistance zones.
Chaos Channels:
Display levels as a fractal chaos channel for enhanced trend analysis.
Fractal Breakout Symbols:
Buy Signals: Upward triangles below the bar.
Sell Signals: Downward triangles above the bar.
Slide 7: Line Connection Modes
All Separate Mode:
Description:
Connects pivot highs with pivot highs and pivot lows with pivot lows separately.
Use Case:
Ideal for traders who want to analyze highs and lows independently.
Sequential Mode:
Description:
Connects all pivot points in the order they occur, regardless of being high or low.
Use Case:
Suitable for identifying overall trend direction and momentum.
Pivot Extension Lines
Purpose:
Trend Continuation:
Visualize the continuation of the latest pivot point's price level.
Customization:
Colors:
Differentiate between bullish and bearish extensions.
Styles:
Solid, dashed, or dotted lines based on user preference.
Width:
Adjustable line thickness for better visibility.
Dynamic Updates:
The extension line updates in real-time as new bars form, providing ongoing trend insights.
Alerts and Notifications
Configurable Alerts:
Fractal Break Arrow:
Triggered when a breakout or breakdown occurs.
Long and Short Signals:
Specific alerts for bullish breakouts (Long) and bearish breakdowns (Short).
Benefits:
Timely Notifications:
Stay informed of critical market movements without constant monitoring.
Automated Trading Strategies:
Integrate with trading bots or automated systems for executing trades based on alerts.
Customization and Optimization
User-Friendly Inputs:
Adjustable Parameters:
Tailor pivot detection sensitivity with left and right lengths.
Color and Style Settings:
Match the indicator aesthetics to personal or platform preferences.
Line Management:
Maximum Lines Displayed:
Prevent chart clutter by limiting the number of lines.
Dynamic Line Handling:
Automatically manage and delete old lines to maintain chart clarity.
Flexibility:
Adapt to Different Markets:
Suitable for various financial instruments including stocks, forex, and cryptocurrencies.
Scalability:
Efficiently handles up to 500 labels and 100 lines for comprehensive analysis.
Practical Use Cases
Identifying Key Support and Resistance:
Entry and Exit Points:
Use pivot levels to determine optimal trade entry and exit points.
Trend Confirmation:
Validate market trends through the connection of pivot points.
Breakout and Breakdown Strategies:
Trading Breakouts:
Enter long positions when price breaks above pivot highs.
Trading Breakdowns:
Enter short positions when price breaks below pivot lows.
Risk Management:
Setting Stop-Loss and Take-Profit Levels:
Utilize pivot levels to place strategic stop-loss and take-profit orders.
Slide 12: Benefits for Traders
Real-Time Analysis:
Provides up-to-date pivot points for timely decision-making.
Enhanced Visualization:
Clear markers and lines improve chart readability and analysis efficiency.
Customizable and Flexible:
Adapt the indicator to fit various trading styles and strategies.
Automated Alerts:
Stay ahead with instant notifications on key market events.
Comprehensive Toolset:
Combines pivot points with fractal analysis for deeper market insights.
Conclusion
Pivot Points LIVE is a robust and versatile indicator designed to enhance your trading strategy through real-time pivot point analysis. With its advanced features, customizable settings, and automated alerts, it equips traders with the tools needed to identify key market levels, execute timely trades, and manage risks effectively.
Ready to Elevate Your Trading?
Explore Pivot Points LIVE and integrate it into your trading toolkit today!
Q&A
Questions?
Feel free to ask any questions or request further demonstrations of the Pivot Points LIVE indicator.

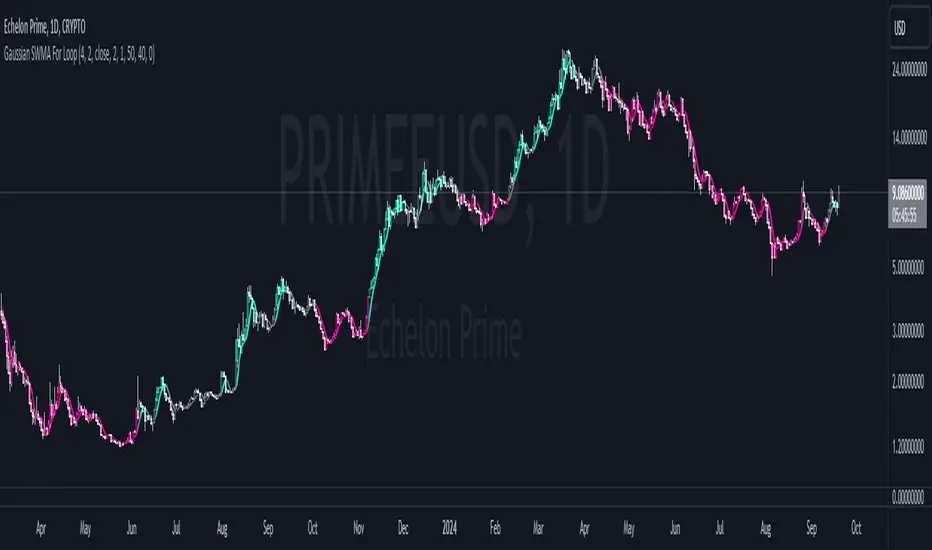
Gaussian SWMA For LoopGaussian SWMA For Loop Indicator
The "Gaussian SWMA For Loop" is a sophisticated indicator designed to identify potential trading opportunities by combining a Gaussian-weighted moving average (WMA) with a simple moving average (SMA), enhanced by a loop-based scoring system. This indicator is tailored for traders looking to capture trends and reversals with a refined approach, making use of advanced filtering techniques and custom thresholds for signal generation.
Key Features:
1. Gaussian Weighted Moving Average (WMA):
The indicator starts by applying a Gaussian filter to the input price data (default is the closing price). The Gaussian filter smooths the data by applying weights according to a Gaussian distribution, determined by the Gaussian Sigma parameter. This results in a smooth, noise-reduced WMA, which is more responsive to significant price movements while ignoring minor fluctuations.
2. Simple Moving Average (SMA) on Smoothed Data:
After the data is smoothed using the Gaussian filter, an SMA is calculated over this smoothed data. The length of this SMA can be adjusted via the SMA Length input, allowing users to control the level of additional smoothing applied to the already filtered data.
3. Loop-Based Scoring System:
Range Analysis: The core feature of this indicator is the loop-based scoring system. It evaluates the filtered SMA by comparing its current value to previous values over a specified range, defined by the From and To parameters.
Score Calculation: The loop iterates through each value within the defined range and adjusts a score based on whether the current filtered SMA is higher or lower than its historical values. This score is a measure of the trend's strength and direction.
Thresholds for Signal Generation: Users can define custom thresholds for long (Long Threshold) and short (Short Threshold) signals. The score is compared against these thresholds to generate buy and sell signals.
4. Signal Generation:
Buy Signal (L): Triggered when the score exceeds the user-defined Long Threshold.
Sell Signal (S): Triggered when the score falls below the Short Threshold.
5. Visual Enhancements:
The indicator plots the filtered SMA on the chart, with the line and bar colors changing based on the buy and sell signals:
Teal (color.rgb(0, 255, 187)) for a buy signal.
Magenta (color.rgb(255, 0, 157)) for a sell signal.
Gray for a neutral condition.
Additionally, the fill between the current and previous SMA values is colored based on the signal, providing a clear visual cue for trend direction and strength.
6. Alert Conditions:
The indicator includes customizable alerts that notify the user when a buy or sell signal is generated:
Long Alert: Notifies when a buy signal is triggered.
Short Alert: Notifies when a sell signal is triggered.
Configurable Inputs:
Main Group:
WMA Length (length): Sets the length of the Gaussian-weighted moving average.
SMA Length (len): Specifies the period for the SMA applied to the Gaussian-smoothed data.
Source (src): The price data used for calculations (default is the closing price).
Gaussian Sigma (sigma): Determines the standard deviation of the Gaussian distribution, influencing the smoothing effect.
For Loop Group:
From (a): The starting point for the loop-based score analysis.
To (b): The endpoint for the loop-based score analysis.
Threshold Group:
Long Threshold (threshold_L): Defines the score threshold above which a buy signal is triggered.
Short Threshold (threshold_S): Defines the score threshold below which a sell signal is triggered.
Practical Use:
This indicator is ideal for traders who want to identify trends and potential reversals with precision. The combination of Gaussian smoothing, SMA, and the loop-based scoring system offers a robust method to filter out noise and focus on significant market moves. The customizable thresholds and alert system further enhance its utility, making it a powerful tool for both manual and automated trading strategies.
Note: As with any trading indicator, it's recommended to backtest the "Gaussian SWMA For Loop" under various market conditions and use it in conjunction with other analysis techniques to confirm signals before making trading decisions.
Swiss Knife [MERT]Introduction
The Swiss Knife indicator is a comprehensive trading tool designed to provide a multi-dimensional analysis of the market. By integrating a wide array of technical indicators across multiple timeframes, it offers traders a holistic view of market sentiment, momentum, and potential reversal points. This indicator is particularly useful for traders looking to combine trend analysis, momentum indicators, volume data, and price action into a single, easy-to-read format.
---
Key Features
Multi-Timeframe Analysis : Evaluates indicators on Daily , 4-Hour , 1-Hour , and 15-Minute timeframes.
Comprehensive Indicator Suite : Incorporates MACD , Awesome Oscillator (AO) , Parabolic SAR , SuperTrend , DPO , RSI , Stochastic Oscillator , Bollinger Bands , Ichimoku Cloud , Chande Momentum Oscillator (CMO) , Donchian Channels , ADX , volume-based momentum indicators, Fractals , and divergence detection.
Market Sentiment Scoring : Aggregates signals from multiple indicators to provide an overall sentiment score.
Visual Aids : Displays EMA lines, trendlines, divergence signals, and a sentiment table directly on the chart.
Super Trend Reversal Signals : Identifies potential market reversal points by assessing the momentum of automated trading bots.
---
Explanation of Each Indicator
Moving Average Convergence Divergence (MACD)
- Purpose : Measures the relationship between two moving averages of price.
- Interpretation : A positive histogram suggests bullish momentum; a negative histogram indicates bearish momentum.
Awesome Oscillator (AO)
- Purpose : Gauges market momentum by comparing recent market movements to historic ones.
- Interpretation : Above zero indicates bullish momentum; below zero indicates bearish momentum.
Parabolic SAR (SAR)
- Purpose : Identifies potential reversal points in price direction.
- Interpretation : Dots below price suggest an uptrend; dots above price suggest a downtrend.
SuperTrend
- Purpose : Determines the prevailing market trend.
- Interpretation : Provides buy or sell signals based on price movements relative to the SuperTrend line.
Detrended Price Oscillator (DPO)
- Purpose : Removes trend from price to identify cycles.
- Interpretation : Values above zero suggest price is above the moving average; values below zero indicate it is below.
Relative Strength Index (RSI)
- Purpose : Measures the speed and change of price movements.
- Interpretation : Values above 50 indicate bullish momentum; values below 50 indicate bearish momentum.
Stochastic Oscillator
- Purpose : Compares a particular closing price to a range of its prices over a certain period.
- Interpretation : Values above 50 indicate bullish conditions; values below 50 indicate bearish conditions.
Bollinger Bands (BB)
- Purpose : Measures market volatility and provides relative price levels.
- Interpretation : Price above the middle band suggests bullishness; below the middle band suggests bearishness.
Ichimoku Cloud
- Purpose : Provides support and resistance levels, trend direction, and momentum.
- Interpretation : Bullish signals when price is above the cloud; bearish signals when price is below the cloud.
Chande Momentum Oscillator (CMO)
- Purpose : Measures momentum on both up and down days.
- Interpretation : Values above 50 indicate strong upward momentum; values below -50 indicate strong downward momentum.
Donchian Channels
- Purpose : Identifies volatility and potential breakouts.
- Interpretation : Price above the upper band suggests bullish breakout; below the lower band suggests bearish breakout.
Average Directional Index (ADX)
- Purpose : Measures the strength of a trend.
- Interpretation : DI+ above DI- indicates bullish trend; DI- above DI+ indicates bearish trend.
Volume Momentum Indicators (VolMom, CumVolMom, POCMom)
- Purpose : Analyze volume to assess buying and selling pressure.
- Interpretation : Positive values suggest bullish volume momentum; negative values indicate bearish volume momentum.
Fractals
- Purpose : Identify potential reversal points in the market.
- Interpretation : Up fractals may indicate a future downtrend; down fractals may indicate a future uptrend.
Divergence Detection
- Purpose : Identifies divergences between price and various indicators (RSI, MACD, Stochastic, OBV, MFI, A/D Line).
- Interpretation : Bullish divergences suggest potential upward reversal; bearish divergences suggest potential downward reversal.
- Note : This functionality utilizes the library from Divergence Indicator .
---
Coloring Scheme
Background Color
- Purpose : Reflects the overall market sentiment by combining sentiment scores from all indicators across different timeframes.
- Interpretation :
- Green Shades : Indicate bullish market sentiment.
- Red Shades : Indicate bearish market sentiment.
- Intensity : The strength of the color corresponds to the strength of the sentiment score.
Sentiment Table
- Purpose : Displays the status of each indicator across different timeframes.
- Interpretation :
- Green Cell : The indicator suggests a bullish signal.
- Red Cell : The indicator suggests a bearish signal.
- Percentage Score : Indicates the overall bullish or bearish sentiment on that timeframe.
Exponential Moving Averages (EMAs)
- Purpose : Provide dynamic support and resistance levels.
- Colors :
- EMA 10 : Lime
- EMA 20 : Yellow
- EMA 50 : Orange
- EMA 100 : Red
- EMA 200 : Purple
Trendlines
- Purpose : Visual representation of support and resistance levels based on pivot points.
- Interpretation :
- Upward Trendlines : Colored green , indicating support levels.
- Downward Trendlines : Colored red , indicating resistance levels.
- Note : Trendlines are drawn using the library from Simple Trendlines .
---
Utility of Market Sentiment
The indicator aggregates signals from multiple technical indicators across various timeframes to compute an overall market sentiment score . This comprehensive approach helps traders understand the prevailing market conditions by:
Confirming Trends : Multiple indicators pointing in the same direction can confirm the strength of a trend.
Identifying Reversals : Divergences and fractals can signal potential turning points.
Timeframe Alignment : Aligning signals across different timeframes can enhance the probability of successful trades.
---
Divergences
Divergence occurs when the price of an asset moves in the opposite direction of a technical indicator, suggesting a potential reversal.
- Bullish Divergence : Price makes a lower low, but the indicator makes a higher low.
- Bearish Divergence : Price makes a higher high, but the indicator makes a lower high.
The indicator detects divergences for:
RSI
MACD
Stochastic Oscillator
On-Balance Volume (OBV)
Money Flow Index (MFI)
Accumulation/Distribution Line (A/D Line)
By identifying these divergences, traders can spot early signs of trend reversals and adjust their strategies accordingly.
---
Trendlines
Trendlines are essential tools for identifying support and resistance levels. The indicator automatically draws trendlines based on pivot points:
- Upward Trendlines (Support) : Connect higher lows, indicating an uptrend.
- Downward Trendlines (Resistance) : Connect lower highs, indicating a downtrend.
These trendlines help traders visualize the trend direction and potential breakout or reversal points.
---
Super Trend Reversals (ST Reversal)
The core idea behind the Super Trend Reversals indicator is to assess the momentum of automated trading bots (often referred to as 'Supertrend bots') that enter the market during critical turning points. Specifically, the indicator is tuned to identify when the market is nearing bottoms or peaks, just before it shifts direction based on the triggered Supertrend signals. This approach helps traders:
Engage Early : Enter the market as reversal momentum builds up.
Optimize Entries and Exits : Enter under favorable conditions and exit before momentum wanes.
By capturing these reversal points, traders can enhance their trading performance.
---
Conclusion
The Swiss Knife indicator serves as a versatile tool that combines multiple technical analysis methods into a single, comprehensive indicator. By assessing various aspects of the market—including trend direction, momentum, volume, and price action—it provides traders with valuable insights to make informed trading decisions.
---
Citations
- Divergence Detection Library : Divergence Indicator by DevLucem
- Trendline Drawing Library : Simple Trendlines by HoanGhetti
---
Note : This indicator is intended for informational purposes and should be used in conjunction with other analysis techniques. Always perform due diligence before making trading decisions.
---

Uptrick: Dynamic AMA RSI Indicator### **Uptrick: Dynamic AMA RSI Indicator**
**Overview:**
The **Uptrick: Dynamic AMA RSI Indicator** is an advanced technical analysis tool designed for traders who seek to optimize their trading strategies by combining adaptive moving averages with the Relative Strength Index (RSI). This indicator dynamically adjusts to market conditions, offering a nuanced approach to trend detection and momentum analysis. By leveraging the Adaptive Moving Average (AMA) and Fast Adaptive Moving Average (FAMA), along with RSI-based overbought and oversold signals, traders can better identify entry and exit points with higher precision and reduced noise.
**Key Components:**
1. **Source Input:**
- The source input is the price data that forms the basis of all calculations. Typically set to the closing price, traders can customize this to other price metrics such as open, high, low, or even the output of another indicator. This flexibility allows the **Uptrick** indicator to be tailored to a wide range of trading strategies.
2. **Adaptive Moving Average (AMA):**
- The AMA is a moving average that adapts its sensitivity based on the dominant market cycle. This adaptation allows the AMA to respond swiftly to significant price movements while smoothing out minor fluctuations, making it particularly effective in trending markets. The AMA adjusts its responsiveness dynamically using a calculated phase adjustment from the dominant cycle, ensuring it remains responsive to the current market environment without being overly reactive to market noise.
3. **Fast Adaptive Moving Average (FAMA):**
- The FAMA is a more sensitive version of the AMA, designed to react faster to price changes. It serves as a signal line in the crossover strategy, highlighting shorter-term trends. The interaction between the AMA and FAMA forms the core of the signal generation, with crossovers between these lines indicating potential buy or sell opportunities.
4. **Relative Strength Index (RSI):**
- The RSI is a momentum oscillator that measures the speed and change of price movements, providing insights into whether an asset is overbought or oversold. In the **Uptrick** indicator, the RSI is used to confirm the validity of crossover signals between the AMA and FAMA, adding an additional layer of reliability to the trading signals.
**Indicator Logic:**
1. **Dominant Cycle Calculation:**
- The indicator starts by calculating the dominant market cycle using a smoothed price series. This involves applying exponential moving averages to a series of price differences, extracting cycle components, and determining the instantaneous phase of the cycle. This phase is then adjusted to provide a phase adjustment factor, which plays a critical role in determining the adaptive alpha.
2. **Adaptive Alpha Calculation:**
- The adaptive alpha, a key feature of the AMA, is computed based on the fast and slow limits set by the trader. This alpha is clamped within these limits to ensure the AMA remains appropriately sensitive to market conditions. The dynamic adjustment of alpha allows the AMA to be highly responsive in volatile markets and more conservative in stable markets.
3. **Crossover Detection:**
- The indicator generates trading signals based on crossovers between the AMA and FAMA:
- **CrossUp:** When the AMA crosses above the FAMA, it indicates a potential bullish trend, suggesting a buy opportunity.
- **CrossDown:** When the AMA crosses below the FAMA, it signals a potential bearish trend, indicating a sell opportunity.
4. **RSI Confirmation:**
- To enhance the reliability of these crossover signals, the indicator uses the RSI to confirm overbought and oversold conditions:
- **Buy Signal:** A buy signal is generated only when the AMA crosses above the FAMA and the RSI confirms an oversold condition, ensuring that the signal aligns with a momentum reversal from a low point.
- **Sell Signal:** A sell signal is triggered when the AMA crosses below the FAMA and the RSI confirms an overbought condition, indicating a momentum reversal from a high point.
5. **Signal Management:**
- To prevent signal redundancy during strong trends, the indicator tracks the last generated signal (buy or sell) and ensures that the next signal is only issued when there is a genuine reversal in trend direction.
6. **Signal Visualization:**
- **Buy Signals:** The indicator plots a "BUY" label below the bar when a buy signal is generated, using a green color to clearly mark the entry point.
- **Sell Signals:** A "SELL" label is plotted above the bar when a sell signal is detected, marked in red to indicate an exit or shorting opportunity.
- **Bar Coloring (Optional):** Traders have the option to enable bar coloring, where green bars indicate a bullish trend (AMA above FAMA) and red bars indicate a bearish trend (AMA below FAMA), providing a visual representation of the market’s direction.
**Customization Options:**
- **Source:** Traders can select the price data input that best suits their strategy (e.g., close, open, high, low, or custom indicators).
- **Fast Limit:** Adjustable sensitivity for the fast response of the AMA, allowing traders to tailor the indicator to different market conditions.
- **Slow Limit:** Sets the slower boundary for the AMA’s sensitivity, providing stability in less volatile markets.
- **RSI Length:** The period for the RSI calculation can be adjusted to fit different trading timeframes.
- **Overbought/Oversold Levels:** These thresholds can be customized to define the RSI levels that trigger buy or sell confirmations.
- **Enable Bar Colors:** Traders can choose whether to enable bar coloring based on the AMA/FAMA relationship, enhancing visual clarity.
**How Different Traders Can Use the Indicator:**
1. **Day Traders:**
- **Uptrick: Dynamic AMA RSI Indicator** is highly effective for day traders who need to make quick decisions in fast-moving markets. The adaptive nature of the AMA and FAMA allows the indicator to respond rapidly to intraday price swings. Day traders can use the buy and sell signals generated by the crossover and RSI confirmation to time their entries and exits with greater precision, minimizing exposure to false signals often prevalent in high-frequency trading environments.
2. **Swing Traders:**
- Swing traders can benefit from the indicator’s ability to identify and confirm trend reversals over several days or weeks. By adjusting the RSI length and sensitivity limits, swing traders can fine-tune the indicator to catch longer-term price movements, helping them to ride trends and maximize profits over medium-term trades. The dual confirmation of crossovers with RSI ensures that swing traders enter trades that have a higher probability of success.
3. **Position Traders:**
- For position traders who hold trades over longer periods, the **Uptrick** indicator offers a reliable method to stay in trades that align with the dominant trend while avoiding premature exits. By adjusting the slow limit and extending the RSI length, position traders can smooth out the indicator’s sensitivity, allowing them to focus on major market shifts rather than short-term volatility. The bar coloring feature also provides a clear visual indication of the overall trend, aiding in trade management decisions.
4. **Scalpers:**
- Scalpers, who seek to profit from small price movements, can use the fast responsiveness of the FAMA in conjunction with the RSI to identify micro-trends within larger market moves. The indicator’s ability to adapt quickly to changing conditions makes it a valuable tool for scalpers looking to execute numerous trades in a short period, capturing profits from minor price fluctuations while avoiding prolonged exposure.
5. **Algorithmic Traders:**
- Algorithmic traders can incorporate the **Uptrick** indicator into automated trading systems. The precise crossover signals combined with RSI confirmation provide clear and actionable rules that can be coded into algorithms. The adaptive nature of the indicator ensures that it can be used across different market conditions and timeframes, making it a versatile component of algorithmic strategies.
**Usage:**
The **Uptrick: Dynamic AMA RSI Indicator** is a versatile tool that can be integrated into various trading strategies, from short-term day trading to long-term investing. Its ability to adapt to changing market conditions and provide clear buy and sell signals makes it an invaluable asset for traders seeking to improve their trading performance. Whether used as a standalone indicator or in conjunction with other technical tools, **Uptrick** offers a dynamic approach to market analysis, helping traders to navigate the complexities of financial markets with greater confidence.
**Conclusion:**
The **Uptrick: Dynamic AMA RSI Indicator** offers a comprehensive and adaptable solution for traders across different styles and timeframes. By combining the strengths of adaptive moving averages with RSI confirmation, it delivers robust signals that help traders capitalize on market trends while minimizing the risk of false signals. This indicator is a powerful addition to any trader’s toolkit, enabling them to make informed decisions with greater precision and confidence. Whether you're a day trader, swing trader, or long-term investor, the **Uptrick** indicator can enhance your trading strategy and improve your market outcomes.

Strategy SEMA SDI WebhookPurpose of the Code:
The strategy utilizes Exponential Moving Averages (EMA) and Smoothed Directional Indicators (SDI) to generate buy and sell signals. It includes features like leverage, take profit, stop loss, and trailing stops. The strategy is intended for backtesting and automating trades based on the specified indicators and conditions.
Key Components and Functionalities:
1.Strategy Settings:
Overlay: The strategy will overlay on the price chart.
Slippage: Set to 1.
Commission Value: Set to 0.035.
Default Quantity Type: Percent of equity.
Default Quantity Value: 50% of equity.
Initial Capital: Set to 1000 units.
Calculation on Order Fills: Enabled.
Process Orders on Close: Enabled.
2.Date and Time Filters:
Inputs for enabling/disabling start and end dates.
Filters to execute strategy only within specified date range.
3.Leverage and Quantity:
Leverage: Adjustable leverage input (default 3).
USD Percentage: Adjustable percentage of equity to use for trades (default 50%).
Initial Capital: Calculated based on leverage and percentage of equity.
4.Take Profit, Stop Loss, and Trailing Stop:
Inputs for enabling/disabling take profit, stop loss, and trailing stop.
Adjustable parameters for take profit percentage (default 25%), stop loss percentage (default 4.8%), and trailing stop percentage (default 1.9%).
Calculations for take profit, stop loss, trailing price, and maximum profit tracking.
5.EMA Calculations:
Fast and slow EMAs.
Smoothed versions of the fast and slow EMAs.
6.SDI Calculations:
Directional movement calculation for positive and negative directional indicators.
Difference between the positive and negative directional indicators, smoothed.
7.Buy/Sell Conditions:
Long (Buy) Condition: Positive DI is greater than negative DI, and fast EMA is greater than slow EMA.
Short (Sell) Condition: Negative DI is greater than positive DI, and fast EMA is less than slow EMA.
8.Strategy Execution:
If buy conditions are met, close any short positions and enter a long position.
If sell conditions are met, close any long positions and enter a short position.
Exit conditions for long and short positions based on take profit, stop loss, and trailing stop levels.
Close all positions if outside the specified date range.
Usage:
This strategy is used to automate trading based on the specified conditions involving EMAs and SDI. It allows backtesting to evaluate performance based on historical data. The strategy includes risk management through take profit, stop loss, and trailing stops to protect gains and limit losses. Traders can customize the parameters to fit their specific trading preferences and risk tolerance. Differently, it can perform leverage analysis and use it as a template.
By using this strategy, traders can systematically execute trades based on technical indicators, helping to remove emotional bias and improve consistency in trading decisions.
Important Note:
This script is provided for educational and template purposes and does not constitute financial advice. Traders and investors should conduct their research and analysis before making any trading decisions.

CCI and MACD Auto Trading Strategy with Risk/RewardOverview:
This strategy combines the Commodity Channel Index (CCI) and the Moving Average Convergence Divergence (MACD) indicators to automate trading decisions. It dynamically sets stop-loss and take-profit levels based on recent lows and highs, ensuring a risk/reward ratio of 1:1.5. This script aims to leverage trend and momentum signals while maintaining effective risk management.
Originality and Usefulness:
This script is not just a simple mashup of CCI and MACD indicators; it incorporates dynamic risk management by setting stop-loss and take-profit levels based on recent price action. This approach helps traders to:
・Identify potential trend reversals using the combination of CCI and MACD signals.
・Manage trades effectively by setting realistic stop-loss and take-profit levels based on recent market data.
・Maintain a balanced risk/reward ratio, which is essential for sustainable trading.
Indicators Used:
・CCI (Commodity Channel Index):
・Measures the deviation of the price from its average over a specified period, typically ranging from -100 to +100.
・Helps identify overbought and oversold conditions.
・MACD (Moving Average Convergence Divergence):
・Utilizes the difference between short-term and long-term moving averages to indicate trend strength and direction.
・Provides momentum signals that can be used for timing entries and exits.
How It Works:
Entry Conditions:
Long Entry:
・The MACD histogram is above zero.
・The CCI crosses above the -100 line.
Short Entry:
・The MACD histogram is below zero.
・The CCI crosses below the +100 line.
Exit Conditions:
Long Positions:
・The stop-loss is set at the recent low.
・The take-profit is set at 1.5 times the distance between the entry price and the stop-loss.
Short Positions:
・The stop-loss is set at the recent high.
・The take-profit is set at 1.5 times the distance between the entry price and the stop-loss.
Risk Management:
・The script dynamically adjusts stop-loss and take-profit levels based on recent market data, ensuring that the risk/reward ratio is maintained at 1:1.5.
・This approach helps in managing the risk effectively while aiming for consistent profits.
Strategy Properties:
・Account Size: Configured for a realistic account size suitable for the average trader.
・Commission and Slippage: Includes settings for realistic commission and slippage to reflect real market conditions.
・Risk per Trade: Designed to risk no more than 5-10% of equity per trade, aligning with sustainable trading practices.
・Backtesting Results: Configured to generate a sufficient sample size (ideally more than 100 trades) for reliable backtesting results.
Revised Backtesting Settings
Ensure that your backtesting settings are realistic:
・Account Size: Set a realistic initial capital suitable for the average trader.
・Commission and Slippage: Include realistic commission fees and slippage.
・Risk Management: Ensure that each trade risks no more than 5-10% of the account equity.
・Sufficient Sample Size: Choose a dataset that will generate more than 100 trades to provide a robust sample size.

Cosine smoothed stochasticDescription
The "Cosine Smoothed Stochastic" indicator leverages advanced Fourier Transform techniques to smooth the traditional Stochastic Oscillator. This approach enhances the signal's reliability and reduces noise, providing traders with a more refined and actionable indicator.
The Stochastic Oscillator is a popular momentum indicator that measures the current price relative to the high-low range over a specified period. It helps identify overbought and oversold conditions, signaling potential trend reversals. By smoothing this indicator with Fourier Transform techniques, we aim to reduce false signals and improve its effectiveness.
The indicator comprises three main components:
Cosine Function: A custom function to compute the cosine of an input scaled by a frequency tuner.
Kernel Function: Utilizes the cosine function to create a smooth kernel, constrained to positive values within a specific range.
Kernel Regression and Multi Cosine: Perform kernel regression over a lookback period, with the multi cosine function summing these regressions at varying frequencies for a composite smooth signal.
Additionally, the indicator includes a volume oscillator to complement the smoothed stochastic signals, providing insights into market volume trends.
Features
Fourier Transform Smoothing: Advanced smoothing technique to reduce noise.
Volume Oscillator: Dynamic volume-based oscillator for additional market insights.
Customizable Inputs: Users can configure key parameters like regression lookback period, tuning coefficient, and smoothing length.
Visual Alerts: Buy and sell signals based on smoothed stochastic crossovers.
Usage
The indicator is designed for trend-following and momentum-based trading strategies . It helps identify overbought and oversold conditions, trend reversals, and potential entry and exit points based on smoothed stochastic values and volume trends.
Inputs
Cosine Kernel Setup:
varient: Choose between "Tuneable" and "Stepped" regression types.
lookbackR: Lookback period for regression.
tuning: Tuning coefficient for frequency adjustment.
Stochastic Calculation:
volshow: Toggle to show the volume oscillator.
emalength: Smoothing period for the Stochastic Oscillator.
lookback_period, m1, m2: Parameters for the Stochastic Oscillator lookback and moving averages.
How It Works
Stochastic Oscillator:
Computes the stochastic %K and smoothes it with an EMA.
Further smoothes %K using the multi cosine function.
Volume Oscillator:
Calculates short and long EMAs of volume and derives the oscillator as the percentage difference.
Plots volume oscillator columns with dynamic coloring based on the oscillator's value and change.
Visual Representation:
Plots smoothed stochastic lines with colors indicating bullish, bearish, overbought, and oversold conditions.
Uses plotchar to mark crossovers between current and previous values of d.
Displays overbought and oversold levels with filled regions between them.
Chart Example
To understand the indicator better, refer to the clean and annotated chart provided. The script is used without additional scripts to maintain clarity. The chart includes:
Smoothed Stochastic Lines: Colored according to trend conditions.
Volume Oscillator: Plotted as columns for visual volume trend analysis.
Overbought/Oversold Levels: Clearly marked levels with filled regions between them.
Alert Conditions
The indicator sets up alerts for buy and sell signals when the smoothed stochastic crosses over or under its previous value. These alerts can be used for automated trading systems or manual trading signals.
breakthrough of the indicators method :
Initialization and Inputs:
The indicator starts by defining necessary inputs, such as the lookback period for regression, tuning coefficient, and smoothing parameters for the Stochastic Oscillator and volume oscillator.
Cosine Function and Kernel Creation:
The cosine function is defined to compute the cosine of an input scaled by a frequency tuner.
The kernel function utilizes this cosine function to create a smoothing kernel, which is constrained to positive values within a specific range.
Kernel Regression:
The kernel regression function iterates over the lookback period, calculating weighted sums of the source values using the kernel function. This produces a smoothed value by dividing the accumulated weighted values by the total weights.
Multi Cosine Smoothing:
The multi cosine function combines multiple kernel regressions at different frequencies, summing these results and averaging them to achieve a composite smoothed value.
Stochastic Calculation and Smoothing:
The traditional Stochastic Oscillator is calculated, and its %K value is smoothed using an EMA.
The smoothed %K is further refined using the multi cosine function, resulting in a more reliable and less noisy signal.
Volume Oscillator Calculation:
The volume oscillator calculates short and long EMAs of the volume and derives the oscillator as the percentage difference between these EMAs. The result is plotted with dynamic coloring to indicate volume trends.
Plotting and Alerts:
The indicator plots the smoothed stochastic lines , overbought/oversold levels, and volume oscillator on the chart.
Buy and sell alerts are set up based on crossovers of the smoothed stochastic values, providing traders with actionable signals.

MA MACD BB BackTesterOverview:
This Pine Script™ code provides a comprehensive backtesting tool that combines Moving Average (MA), Moving Average Convergence Divergence (MACD), and Bollinger Bands (BB). It is designed to help traders analyze market trends and make informed trading decisions by testing various strategies over historical data.
Key Features:
1. Customizable Indicators:
Moving Average (MA): Smooths out price data for clearer trend direction.
MACD: Measures trend momentum through MACD Line, Signal Line, and Histogram.
Bollinger Bands (BB): Identifies overbought or oversold conditions with upper and lower bands.
2. Flexible Trading Direction: Choose between long or short positions to adapt to different market conditions.
3. Risk Management: Efficiently allocate your capital with customizable position sizes.
4. Signal Generation:
Buy Signals: Triggered by crossovers for MACD, MA, and BB.
Sell Signals: Triggered by crossunders for MACD, MA, and BB.
5. Automated Trading: Automatically enter and exit trades based on signal conditions and strategy parameters.
How It Works:
1. Indicator Selection: Select your preferred indicator (MA, MACD, BB) and trading direction (Long/Short).
2. Risk Management Configuration: Set the percentage of capital to allocate per position to manage risk effectively.
3.Signal Detection: The algorithm identifies and plots buy/sell signals directly on the chart based on the chosen indicator.
4. Trade Execution: The strategy automatically enters and exits trades based on signal conditions and configured strategy parameters.
Use Cases:
- Backtesting: Evaluate the effectiveness of trading strategies using historical data to understand potential performance.
- Strategy Development: Customize and expand the strategy to incorporate additional indicators or conditions to fit specific trading styles.
ADDONS That Affect Strategy:
1. Indicator Parameters:
Adjustments to the settings of MACD (e.g., fast length, slow length), MA (e.g., length), and BB (e.g., length, multiplier) will directly impact the detection of signals and the strategy's performance.
2. Trading Direction:
Changing the trading direction (Long/Short) will alter the entry and exit conditions based on the detected signals.
3. Risk Management Settings:
Modifying the position size percentage affects capital allocation and overall risk exposure per trade.
ADDONS That Do Not Affect Strategy:
1. Visual Customizations:
Changes to the color, shape, and style of the plotted lines and signals do not impact the core functionality of the strategy but enhance visual clarity.
2. Text and Labels:
Modifying text labels for the signals (such as renaming "Buy MACD" to "MACD Buy Signal") is purely cosmetic and does not influence the strategy’s logic or outcomes.
Notes:
- Customization: The indicator is highly customizable to fit various trading styles and market conditions.
- Risk Management: Adjust position sizes and risk parameters according to your risk tolerance and account size.
- Optimization: Regularly backtest and optimize parameters to adapt to changing market dynamics for better performance.
Getting Started:
-Add the script to your chart.
-Adjust the input parameters to suit your analysis preferences.
-Observe the marked buy and sell signals on your chart to make informed trading decisions.

Normalised T3 Oscillator [BackQuant]Normalised T3 Oscillator
The Normalised T3 Oscillator is an technical indicator designed to provide traders with a refined measure of market momentum by normalizing the T3 Moving Average. This tool was developed to enhance trading decisions by smoothing price data and reducing market noise, allowing for clearer trend recognition and potential signal generation. Below is a detailed breakdown of the Normalised T3 Oscillator, its methodology, and its application in trading scenarios.
1. Conceptual Foundation and Definition of T3
The T3 Moving Average, originally proposed by Tim Tillson, is renowned for its smoothness and responsiveness, achieved through a combination of multiple Exponential Moving Averages and a volume factor. The Normalised T3 Oscillator extends this concept by normalizing these values to oscillate around a central zero line, which aids in highlighting overbought and oversold conditions.
2. Normalization Process
Normalization in this context refers to the adjustment of the T3 values to ensure that the oscillator provides a standard range of output. This is accomplished by calculating the lowest and highest values of the T3 over a user-defined period and scaling the output between -0.5 to +0.5. This process not only aids in standardizing the indicator across different securities and time frames but also enhances comparative analysis.
3. Integration of the Oscillator and Moving Average
A unique feature of the Normalised T3 Oscillator is the inclusion of a secondary smoothing mechanism via a moving average of the oscillator itself, selectable from various types such as SMA, EMA, and more. This moving average acts as a signal line, providing potential buy or sell triggers when the oscillator crosses this line, thus offering dual layers of analysis—momentum and trend confirmation.
4. Visualization and User Interaction
The indicator is designed with user interaction in mind, featuring customizable parameters such as the length of the T3, normalization period, and type of moving average used for signals. Additionally, the oscillator is plotted with a color-coded scheme that visually represents different strength levels of the market conditions, enhancing readability and quick decision-making.
5. Practical Applications and Strategy Integration
Traders can leverage the Normalised T3 Oscillator in various trading strategies, including trend following, counter-trend plays, and as a component of a broader trading system. It is particularly useful in identifying turning points in the market or confirming ongoing trends. The clear visualization and customizable nature of the oscillator facilitate its adaptation to different trading styles and market environments.
6. Advanced Features and Customization
Further enhancing its utility, the indicator includes options such as painting candles according to the trend, showing static levels for quick reference, and alerts for crossover and crossunder events, which can be integrated into automated trading systems. These features allow for a high degree of personalization, enabling traders to mold the tool according to their specific trading preferences and risk management requirements.
7. Theoretical Justification and Empirical Usage
The use of the T3 smoothing mechanism combined with normalization is theoretically sound, aiming to reduce lag and false signals often associated with traditional moving averages. The practical effectiveness of the Normalised T3 Oscillator should be validated through rigorous backtesting and adjustment of parameters to match historical market conditions and volatility.
8. Conclusion and Utility in Market Analysis
Overall, the Normalised T3 Oscillator by BackQuant stands as a sophisticated tool for market analysis, providing traders with a dynamic and adaptable approach to gauging market momentum. Its development is rooted in the understanding of technical nuances and the demand for a more stable, responsive, and customizable trading indicator.
Thus following all of the key points here are some sample backtests on the 1D Chart
Disclaimer: Backtests are based off past results, and are not indicative of the future.
INDEX:BTCUSD
INDEX:ETHUSD
BINANCE:SOLUSD

Big RunnerPresenting the "Big Runner" technique, dubbed "Sprinter," which is intended to help traders looking for momentum chances recognise important market swings. This approach maximises profit potential while controlling risk by using trend ribbons and moving averages to identify entry and exit locations.
Important characteristics:
Moving Averages: To determine the direction of the underlying trend, moving averages, both rapid and slow, are used. Depending on their preferred trading strategy, traders can alter the duration of these averages.
Trend Ribbon: Shows phases of bullish and bearish momentum by using a ribbon indicator to visualise the strength of the trend. Trend transitions are simple to spot for traders so they can make wise decisions.
Buy and Sell Signals: This tool generates buy and sell signals that indicate possible entry and exit opportunities based on the crossing and crossunder of moving averages.
Stop Loss/Take Profit Management: This feature enables traders to successfully apply risk management methods by giving them the ability to set stop loss and take profit levels as a percentage of the entry price.
Dynamic Position Sizing: Optimises capital allocation for every trade by dynamically calculating position size depending on leverage and portfolio proportion.
Implementation:
Long Entry: Started when a bullish trend is indicated by a price cross above the fast and slow moving averages. To control risk and lock in earnings, stop loss and take profit thresholds are established appropriately.
Short Entry: Indicates a bearish trend when the price crosses below both moving averages. The concepts of risk management are similar, with dynamic calculations used to determine take-profit and stop-loss levels.
Extra Personalisation:
Take Profit/Stop Loss Management: Provides the ability to select a take profit and stop loss
API Integration: This feature improves execution flexibility and efficiency by enabling traders to include custom parameters for automated trading.
Notice:
Trading entails risk, and performances in the past do not guarantee future outcomes. Before making any trades with this approach, careful analysis and risk management are necessary.
In summary:
By integrating risk management procedures with technical indicators, the "Big Runner" strategy provides a thorough method for identifying noteworthy market changes and achieving the best possible trading results. Traders can adjust parameters to suit their interests and style of trading, giving them the confidence to traverse volatile market situations.
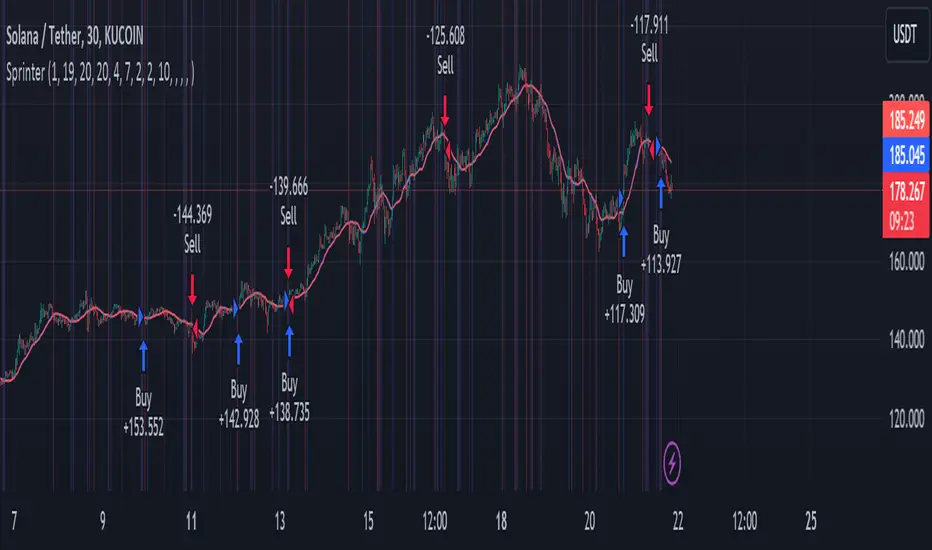
TrippleMACDCryptocurrency Scalping Strategy for 1m Timeframe
Introduction:
Welcome to our cutting-edge cryptocurrency scalping strategy tailored specifically for the 1-minute timeframe. By combining three MACD indicators with different parameters and averaging them, along with applying RSI, we've developed a highly effective strategy for maximizing profits in the cryptocurrency market. This strategy is designed for automated trading through our bot, which executes trades using hooks. All trades are calculated for long positions only, ensuring optimal performance in a fast-paced market.
Key Components:
MACD (Moving Average Convergence Divergence):
We've utilized three MACD indicators with varying parameters to capture different aspects of market momentum.
Averaging these MACD indicators helps smooth out noise and provides a more reliable signal for trading decisions.
RSI (Relative Strength Index):
RSI serves as a complementary indicator, providing insights into the strength of bullish trends.
By incorporating RSI, we enhance the accuracy of our entry and exit points, ensuring timely execution of trades.
Strategy Overview:
Long Position Entries:
Initiate long positions when all three MACD indicators signal bullish momentum and the RSI confirms bullish strength.
This combination of indicators increases the probability of successful trades, allowing us to capitalize on uptrends effectively.
Utilizing Linear Regression:
Linear regression is employed to identify consolidation phases in the market.
Recognizing consolidation periods helps us avoid trading during choppy price action, ensuring optimal performance.
Suitability for Grid Trading Bots:
Our strategy is well-suited for grid trading bots due to frequent price fluctuations and opportunities for grid activation.
The strategy's design accounts for price breakthroughs, which are advantageous for grid trading strategies.
Benefits of the Strategy:
Consistent Performance Across Cryptocurrencies:
Through rigorous testing on various cryptocurrency futures contracts, our strategy has demonstrated favorable results across different coins.
Its adaptability makes it a versatile tool for traders seeking consistent profits in the cryptocurrency market.
Integration of Advanced Techniques:
By integrating multiple indicators and employing linear regression, our strategy leverages advanced techniques to enhance trading performance.
This strategic approach ensures a comprehensive analysis of market conditions, leading to well-informed trading decisions.
Conclusion:
Our cryptocurrency scalping strategy offers a sophisticated yet user-friendly approach to trading in the fast-paced environment of the 1-minute timeframe. With its emphasis on automation, accuracy, and adaptability, our strategy empowers traders to navigate the complexities of the cryptocurrency market with confidence. Whether you're a seasoned trader or a novice investor, our strategy provides a reliable framework for achieving consistent profits and maximizing returns on your investment.

Goertzel Adaptive JMA T3Hello Fellas,
The Goertzel Adaptive JMA T3 is a powerful indicator that combines my own created Goertzel adaptive length with Jurik and T3 Moving Averages. The primary intention of the indicator is to demonstrate the new adaptive length algorithm by applying it on bleeding-edge MAs.
It is useable like any moving average, and the new Goertzel adaptive length algorithm can be used to make own indicators Goertzel adaptive.
Used Adaptive Length Algorithms
Normalized Goertzel Power: This uses the normalized power of the Goertzel algorithm to compute an adaptive length without the special operations, like detrending, Ehlers uses for his DFT adaptive length.
Ehlers Mod: This uses the Goertzel algorithm instead of the DFT, originally used by Ehlers, to compute a modified version of his original approach, which sticks as close as possible to the original approach.
Scoring System
The scoring system determines if bars are red or green and collects them.
Then, it goes through all collected red and green bars and checks how big they are and if they are above or below the selected MA. It is positive when green bars are under MA or when red bars are above MA.
Then, it accumulates the size for all positive green bars and for all positive red bars. The same happens for negative green and red bars.
Finally, it calculates the score by ((positiveGreenBars + positiveRedBars) / (negativeGreenBars + negativeRedBars)) * 100 with the scale 0–100.
Signals
Is the price above MA? -> bullish market
Is the price below MA? -> bearish market
Usage
Adjust the settings to reach the highest score, and enjoy an outstanding adaptive MA.
It should be useable on all timeframes. It is recommended to use the indicator on the timeframe where you can get the highest score.
Now, follows a bunch of knowledge for people who don't know about the concepts used here.
T3
The T3 moving average, short for "Tim Tillson's Triple Exponential Moving Average," is a technical indicator used in financial markets and technical analysis to smooth out price data over a specific period. It was developed by Tim Tillson, a software project manager at Hewlett-Packard, with expertise in Mathematics and Computer Science.
The T3 moving average is an enhancement of the traditional Exponential Moving Average (EMA) and aims to overcome some of its limitations. The primary goal of the T3 moving average is to provide a smoother representation of price trends while minimizing lag compared to other moving averages like Simple Moving Average (SMA), Weighted Moving Average (WMA), or EMA.
To compute the T3 moving average, it involves a triple smoothing process using exponential moving averages. Here's how it works:
Calculate the first exponential moving average (EMA1) of the price data over a specific period 'n.'
Calculate the second exponential moving average (EMA2) of EMA1 using the same period 'n.'
Calculate the third exponential moving average (EMA3) of EMA2 using the same period 'n.'
The formula for the T3 moving average is as follows:
T3 = 3 * (EMA1) - 3 * (EMA2) + (EMA3)
By applying this triple smoothing process, the T3 moving average is intended to offer reduced noise and improved responsiveness to price trends. It achieves this by incorporating multiple time frames of the exponential moving averages, resulting in a more accurate representation of the underlying price action.
JMA
The Jurik Moving Average (JMA) is a technical indicator used in trading to predict price direction. Developed by Mark Jurik, it’s a type of weighted moving average that gives more weight to recent market data rather than past historical data.
JMA is known for its superior noise elimination. It’s a causal, nonlinear, and adaptive filter, meaning it responds to changes in price action without introducing unnecessary lag. This makes JMA a world-class moving average that tracks and smooths price charts or any market-related time series with surprising agility.
In comparison to other moving averages, such as the Exponential Moving Average (EMA), JMA is known to track fast price movement more accurately. This allows traders to apply their strategies to a more accurate picture of price action.
Goertzel Algorithm
The Goertzel algorithm is a technique in digital signal processing (DSP) for efficient evaluation of individual terms of the Discrete Fourier Transform (DFT). It's particularly useful when you need to compute a small number of selected frequency components. Unlike direct DFT calculations, the Goertzel algorithm applies a single real-valued coefficient at each iteration, using real-valued arithmetic for real-valued input sequences. This makes it more numerically efficient when computing a small number of selected frequency components¹.
Discrete Fourier Transform
The Discrete Fourier Transform (DFT) is a mathematical technique used in signal processing to convert a finite sequence of equally-spaced samples of a function into a same-length sequence of equally-spaced samples of the discrete-time Fourier transform (DTFT), which is a complex-valued function of frequency . The DFT provides a frequency domain representation of the original input sequence .
Usage of DFT/Goertzel In Adaptive Length Algorithms
Adaptive length algorithms are automated trading systems that can dynamically adjust their parameters in response to real-time market data. This adaptability enables them to optimize their trading strategies as market conditions fluctuate. Both the Goertzel algorithm and DFT can be used in these algorithms to analyze market data and detect cycles or patterns, which can then be used to adjust the parameters of the trading strategy.
The Goertzel algorithm is more efficient than the DFT when you need to compute a small number of selected frequency components. However, for covering a full spectrum, the Goertzel algorithm has a higher order of complexity than fast Fourier transform (FFT) algorithms.
I hope this can help you somehow.
Thanks for reading, and keep it up.
Best regards,
simwai
---
Credits to:
@ClassicScott
@yatrader2
@cheatcountry
@loxx
